There are various ways to organise your R workflow. If you are working with a big project, then Airflow might be for you. But for the majority of R project codes, drake package will fullfilled your need.
Here is the basic use of drake. The example here will be using a simple
collections of functions.
  fun1 <- function(x = globalenv()$x){
    x + 2
  }

  fun2 <- function(i = 3){
    i * 10
  }

  fun3 <- function(){
    x1 = fun1()
    x2 = fun2(5)

    x1 + x2
  }

  fun4 <- function(z = globalenv()$z){
    x1 = 1 + z
    x2 = fun2(2)
    x3 = fun3()

    x1 + x2 + x3
  }
Install drake development version in Github here.
  remotes::install_github("ropensci/drake")
  library(drake)

  x = 3
  z = 5

  plan <- drake_plan(
    output = fun4()
  )

  make(plan)
Running make(plan) will give the overview what is in the plan, sort of like using Make.
  ▶ target x
  ▶ target z
  ▶ target output
Then you can make the interactive network to see all the workflow. This can be done several ways.
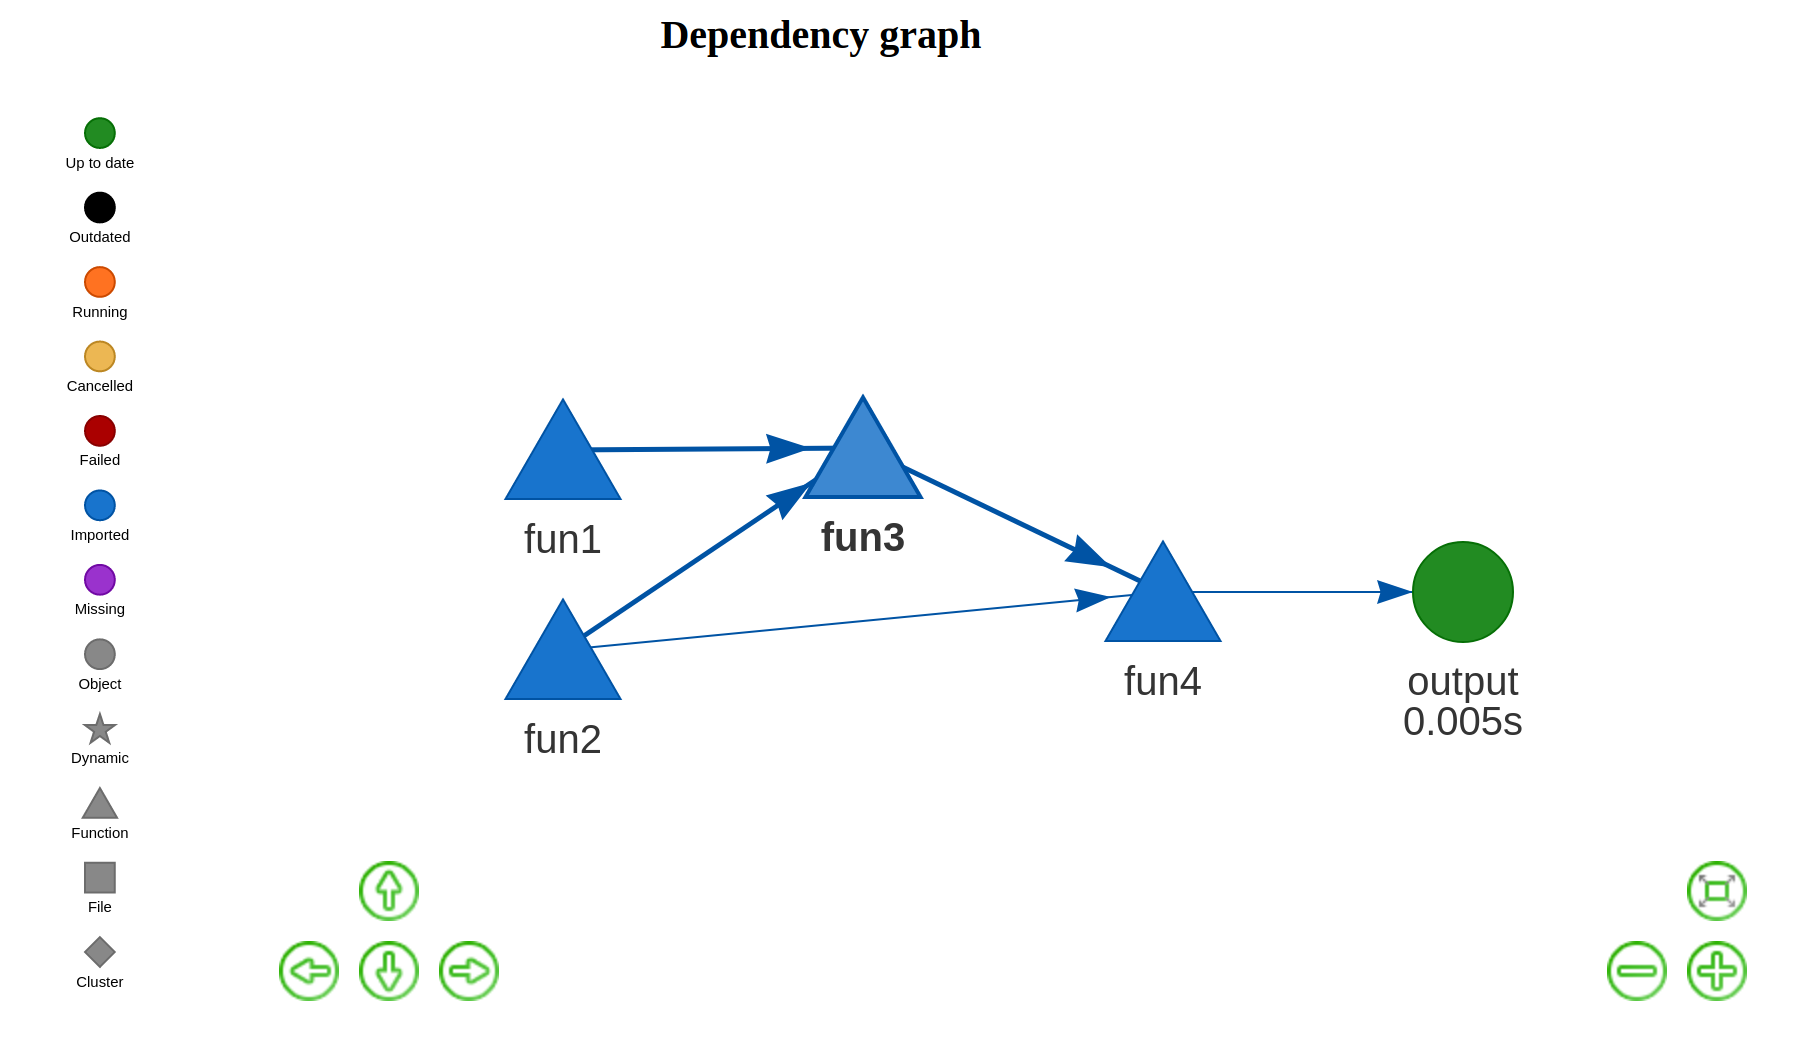
  library("visNetwork")
  vis_drake_graph(plan, full_legend = TRUE)

  ## need networkD3 package
  library(networkD3)
  sankey_drake_graph(plan)

  library(ggraph)
  drake_ggraph(plan)

  ## To show only target and dependency
  plot(plan)

  ## read the build target
  readd(output)
This how it looks like using vis_drake_graph. For interactive can be seen here.